The Progress Group 250 Driver Grades: How Every Driver Scored at Talladega Superspeedway
Oct 24, 2026
·
2 min read·
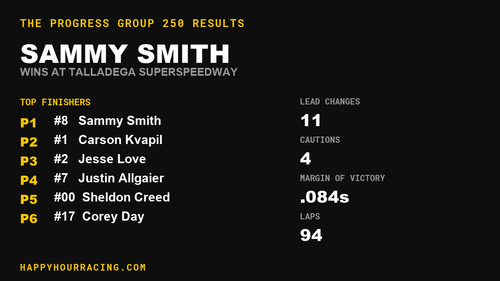
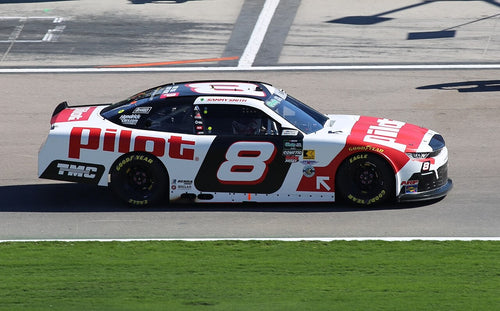
Every driver from the The Progress Group 250 at Talladega Superspeedway, graded on what the scoring loops actually recorded: where they started, where they finished, how many laps they led, and whether they were still running at the end. Sammy Smith grades out best with a A+.
How the grades are calculated
The grade is a formula, not an opinion. Each driver starts from their finishing position, gains credit for passing cars and for leading laps, and loses credit for not finishing:
-
Finish: the single biggest factor, scaled from the win down through the field.
-
Positions gained: starting position minus finishing position, capped so a deep starting spot cannot buy a top grade on its own.
-
Laps led: share of the race led, worth up to a full letter grade.
-
Did not finish: a fixed penalty if they were not running at the checkered flag.
Driver grades
| Grade |
Driver |
Car |
Start |
Finish |
Laps led |
Points |
| A+ |
Sammy Smith |
8 |
11 |
1 |
1 |
63 |
| A+ |
Carson Kvapil |
1 |
4 |
2 |
67 |
54 |
| A+ |
Justin Allgaier |
7 |
14 |
4 |
11 |
51 |
| A+ |
Blaine Perkins |
31 |
36 |
7 |
|
30 |
| A+ |
Dean Thompson |
26 |
27 |
8 |
|
29 |
| A+ |
Sheldon Creed |
00 |
12 |
5 |
|
43 |
| A |
Jesse Love |
2 |
1 |
3 |
|
34 |
| A |
Corey Day |
17 |
10 |
6 |
4 |
44 |
| A |
Jeb Burton |
27 |
32 |
11 |
|
26 |
| A |
Brandon Jones |
20 |
16 |
9 |
|
28 |
| A- |
Mason Maggio |
91 |
24 |
12 |
|
25 |
| A- |
Ryan Sieg |
39 |
25 |
14 |
|
23 |
| A- |
Josh Bilicki |
07 |
35 |
16 |
|
21 |
| B+ |
Anthony Alfredo |
96 |
7 |
10 |
|
29 |
| B |
Lee Pulliam |
87 |
38 |
22 |
|
15 |
| B |
Nick Leitz |
42 |
13 |
15 |
|
0 |
| B |
Joey Gase |
55 |
28 |
20 |
1 |
17 |
| B |
Sam Mayer |
41 |
3 |
13 |
|
24 |
| B |
Connor Mosack |
43 |
23 |
19 |
|
0 |
| B- |
Jeremy Clements |
51 |
15 |
18 |
|
21 |
| C+ |
Rajah Caruth |
88 |
6 |
17 |
|
29 |
| C+ |
Brennan Poole |
44 |
34 |
26 |
|
12 |
| C+ |
Taylor Gray |
54 |
17 |
21 |
1 |
20 |
| C+ |
Garrett Smithley |
0 |
37 |
27 |
|
10 |
| C+ |
Will Rodgers |
53 |
30 |
25 |
|
12 |
| C+ |
Josh Williams |
92 |
22 |
23 |
|
14 |
| C |
Harrison Burton |
24 |
19 |
24 |
8 |
17 |
| C |
Kyle Sieg |
28 |
29 |
28 |
|
9 |
| D |
Daniel Dye |
32 |
33 |
33 |
|
0 |
| D |
Parker Retzlaff |
99 |
26 |
31 |
|
6 |
| D |
Ryan Ellis |
02 |
20 |
30 |
1 |
7 |
| D |
William Sawalich |
18 |
9 |
29 |
|
9 |
| D |
Patrick Staropoli |
48 |
21 |
32 |
|
5 |
| D |
Leland Honeyman |
71 |
31 |
36 |
|
0 |
| D |
Brent Crews |
19 |
8 |
34 |
|
6 |
| D |
Austin Hill |
21 |
5 |
35 |
|
9 |
| F |
Caesar Bacarella |
4 |
18 |
37 |
|
1 |
| F |
Lavar Scott ()
|
45 |
41 |
41 |
|
0 |
| F |
Carson Ware ()
|
47 |
41 |
41 |
|
0 |
| F |
Patrick Emerling ()
|
38 |
41 |
41 |
|
0 |
| F |
Jake Finch (Accident)
|
9 |
2 |
38 |
|
4 |
Schedule and standings
See the rest of the season and the updated standings on the NASCAR O'Reilly Series schedule and standings page, or browse every Cup driver and every team.
Get the winner's gear